|
|
|
|||||||||||||||||||||||
|
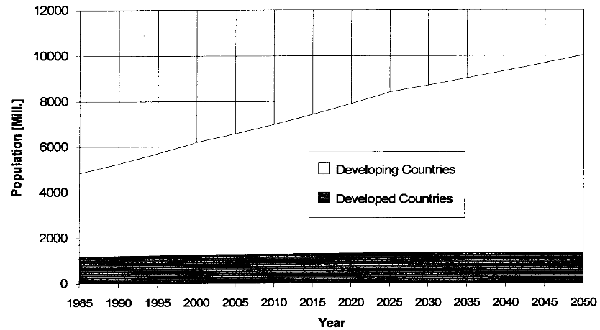
1 Introduction: Crop Production and Crop LossesThe present human population of the world is 5.7 billion, increasing at an annual rate of 1.6 %. According to the latest estimates, the rate of population growth will decrease slowly during the next century, and the world population is expected to stabilize at about 11.5 billion shortly after the year 2100. Figure 1.1 shows the expected growth in the nearer future.
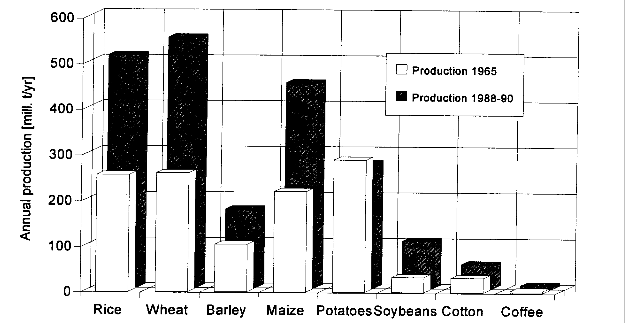
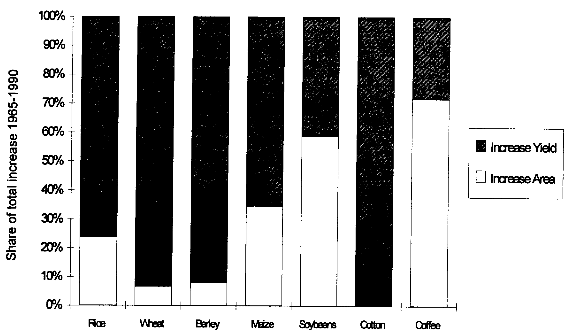
The rapid population growth in general and the fact that most of the population growth takes place in developing countries rises the question how these additional people can be fed. Basically, there are two different possibilities to increase food production: Enlarging crop yields on already cultured land, or expanding the area of cultured land on previously uncultured land. Reviewing the development of crop production since 1965 reveals a massive increase. Figure 1.2 shows the differences in production between 1965 and 1988-90 (average of three year period) of the eight most important food and cash crops. The production of rice, wheat and maize, which are the most important crops for human nutrition, doubled during the last 25 years. Figure 1.3 indicates that most of the production increase was due to higher yields per area. Higher yields per area were possible because of the introduction of high-yielding varieties, improved cultivation techniques, fertilizer use and chemical crop protection measures - a development which has been termed "green revolution".
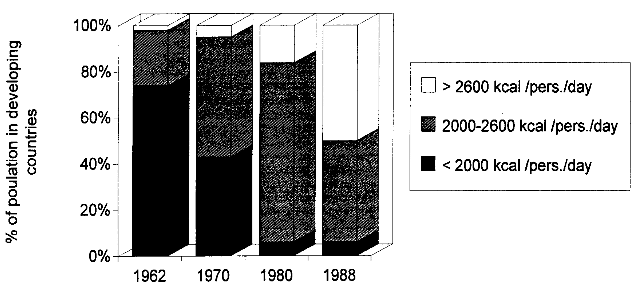
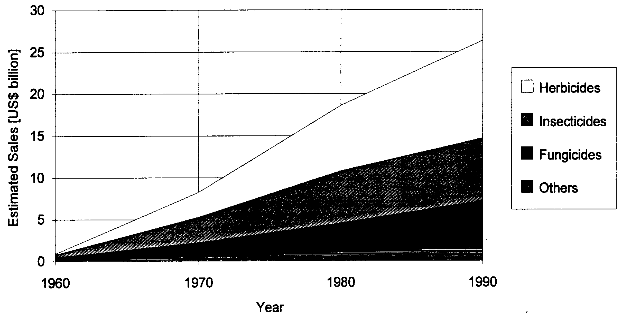
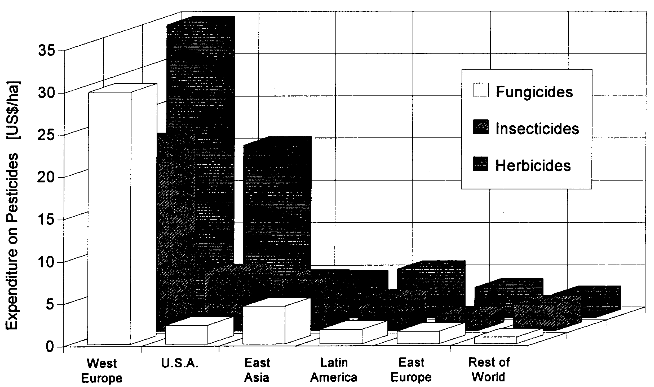
The intensification of crop production improved the level of food consumption in most developing countries (figure 1.4) during the last 30 years despite a world population growth of 2.4 billion in the same period. However, the intensification also led to a number of disadvantageous side-effects like erosion, deterioration of soil quality, salinization, and others. Every year, about 1 % of the cultured area has to be replaced because of these reasons. Especially in developed countries, the use of agrochemicals is a growing public concern. The amount of crop protection products used has risen steadily during the past 30 years (figure 1.5). Presently, more than 25 billion US$ per year are spent for herbicides, fungicides, insecticides, soil disinfectants and growth regulators. In Western Europe, the most crop protection products are used per area of arable land, followed by the USA. Figure 1.6 shows the expenditure per area in these and the other principal farming regions of the world.
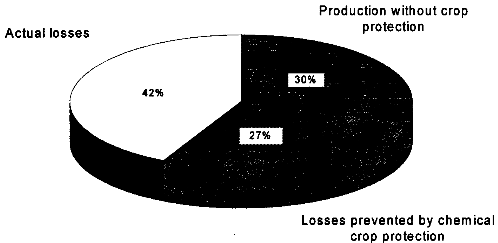
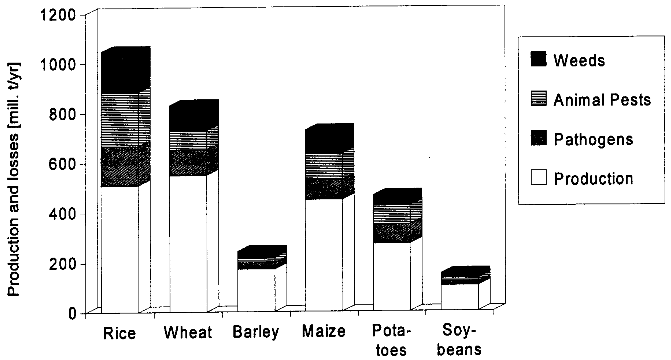
As can be seen in figure 1.7, losses prevented by chemical crop protection are about 27 % (weeds 16 %, animal pests 7 %, diseases 4 %) of attainable production in the eight principal food and cash crops. Nevertheless, about 42 % of total production in these crops are lost to weeds (13 %), animal pests (16 %) and pathogens (13 %), representing a market value of about 244 billion US$ (1989). The losses in the different crops are shown in figure 1.8.
Despite the use of pesticides, not only the absolute amount of losses, but also relative losses have increased by about 3 to 10 % in the past 30 years (only in coffee the relative losses were reduced by about 5 %). This is thought to be due to the higher susceptibility of the high-yielding varieties, the development of resistance to chemical pesticides in pest and pathogen populations, the use of fertilizers which not only promote growth but also increase susceptibility, and the extension of production into regions where the pressure from pests, pathogens and weeds is higher. The losses have increased predominantly in developing countries, where appropriate crop protection measures often cannot be taken because of their high price and/or lack of knowledge.[1] Plant genetic engineering may contribute substantially to the development of new pest and disease resistant varieties by increasing the speed of conventional breeding and by transferring useful genes from various plants and other organisms into crops. In the following chapters of this report, the principal methods used to achieve these goals are described. The present state of the art of genetic engineering for pest and disease resistance and applications in development or already realized will be presented. A brief discussion of safety issues raised and the regulatory framework for field releases and market introduction complements the topic. As not only plants, but also other organisms like bacteria or viruses are genetically engineered in order to prevent crop losses, these approaches are al so briefly described.
|
||||||||||||||||||||||||
|
|



 Produkten.